
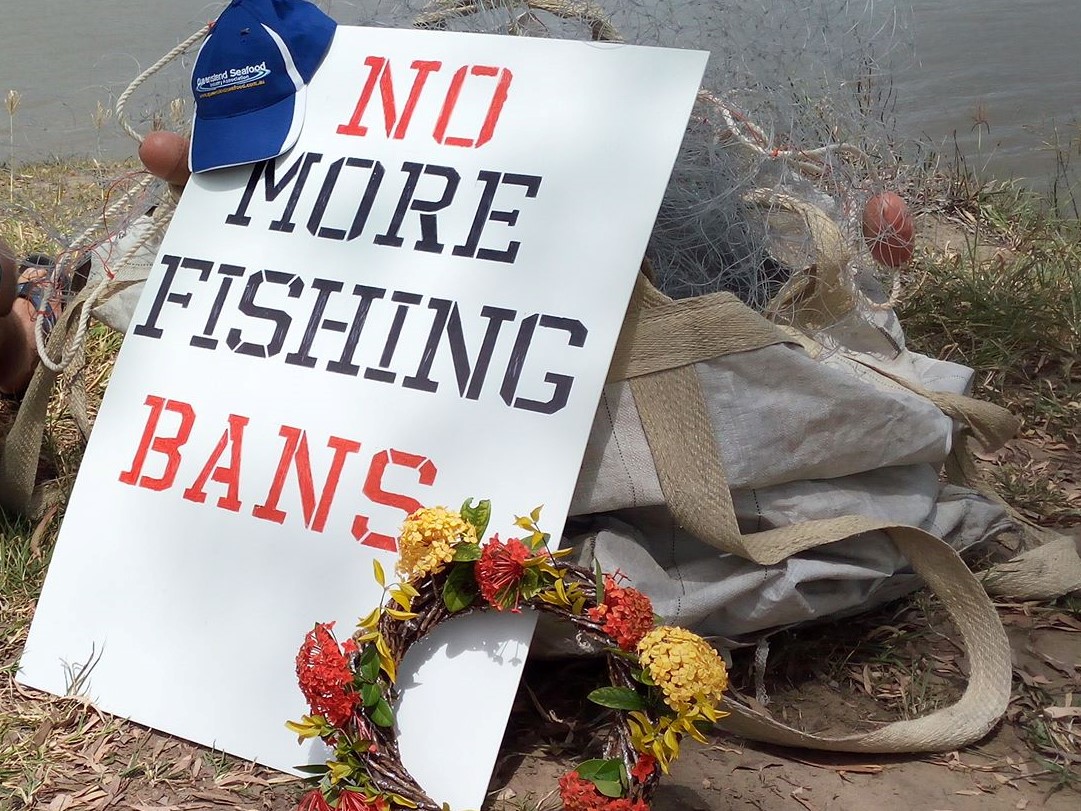
Avoiding a Net Free Zone in Moreton Bay
Welcome to 2019 and I truly wish we could start on a positive note. Some of you will be aware of the recent of the Moreton Bay working group and their 14 December 2018 communique.
It appears the issue of net free zones (NFZs) has surfaced in the Moreton Bay working group. The Association has contacted the Minister seeking an assurance that the State government is not intending to fund a NFZ in Moreton Bay or planning to fund one in the 2020 State election year – letter to Minister Furner
Industry is hoping that the NFZs is a policy of the past. Government and Fisheries Queensland have kept the policy very much alive. There existence of the Reallocation of Fisheries Resources Policy suggests that government doesn’t really want to leave NFZs in the past.
I neglected to write about the third anniversary of one of the more sorry chapters in fisheries policy making – the introduction of NFZs. The net free zones were announced on 1 November 2015 – a poorly constructed, politically motivated policy developed for the sole purpose of securing recreational fishing votes. Catch and serve data for 2004-05 to 2013-14 period from the Cairns, Rockhampton and Mackay regions can be found here: Catch and Serve Data_2004-05 to 2013-14
So what was lost – over the 2004-5 to 2013-14 period 2,243 t of fish were harvested in the Cairns, Rockhampton and Mackay regions. On average, the State has lost 224.3 t / year of local caught fish not only going to local supply chains but also exported to other states and overseas. Over the 2004-5 to 2013-14 period 8,972,000 (150g) serves of fish were harvested. The State has lost 897,200 serves / year of local caught fish not going to local supply chains.
Three years into the policy and surprisingly there is no tourism mecca created from the policy’s introduction and that the policy was created just to facilitate access for local creational fishing groups. So what if the zones had not been introduced?
What has been lost as a result of the NFZs?
Using the average catch data (e.g. Barramundi 74 t / year) and serving data (e.g. Barramundi 294,400 / year) for the following species – Barramundi, Flathead, Mullet, Blue/King/Flat Threadfin, Grey Mackerel, Queenfish and Whiting calculated from catch data between 2004-05 to 2013-14 period for hypothetical catch period over 2014-15, 2015-16 and 2016-17 respectively – Hypothetical Catch Data Sheet
What if Commercial Catch continued in Cairns, Mackay and Rockhampton?
- Over the 2004-5 to 2016-17 period it is estimated that 2,916 t of fish could have been harvested in the Cairns, Rockhampton and Mackay regions.
- On average, the State may have lost 291.6 t / year of local caught fish not only going to local supply chains.
- What has industry and the consumer lost (on average) in terms of catch in the last three years? The estimate is 672 t of fish.
What is the loss of fish serves as a result of NFZs?
- Over the 2004-5 to 2016-17 period it is estimated that 11,663,600 serves of fish could have been harvested in the Cairns, Rockhampton and Mackay regions.
- On average, the State may have lost 1,166,360 serves / year of local caught fish has been lost to local supply chains.
- What has industry and the consumer lost (on average) in terms of 15og serves in the last three years? The estimate is 2,691,600 serves of fish.
Hypothetical Catch and Serve Data
Author: Eric Perez, CEO, QSIA
Image: Save the Professional Fishing Industry
The content of this post is provided for information purposes only and unless otherwise stated is not formal QSIA policy. The information on these posts are provided on the basis that all persons accessing the information undertake their own responsibility for assessing the relevance and accuracy of it.